Tuesday, March 31, 2009

Green Tea Extract Increases Insulin Sensitivity & Fat Burning during Exercise

Green Tea Extract Increases Insulin Sensitivity & Fat Burning during Exercise
Chasing your burger and fries with a mug of green tea may be a good idea. (Photo by w00kie)

The effect of green tea on weight loss and insulin sensitivity is still relatively unknown. There are some promising studies out there, but conflicting data also exists, making it difficult to put all the pieces together. For now, however, the good news for green tea keep coming.

Since most of the studies are either done in vitro, in animals or in human subjects suffering from various conditions such as diabetes, coming across a study on healthy subjects is always interesting. In their paper, Venables et al. investigated the effect of green tea extract on glucose tolerance and fat oxidation during moderate-intensity exercise in healthy young men.

Green tea extract and fat burning during exercise

In the first experiment, each participant completed a 30-minute cycling exercise before and after green tea supplementation in a crossover design. The average relative exercise intensity was similar in both trials. However, fat oxidation (which is the technical term for "burning" fat) was significantly higher when the participants had taken the green tea extract supplement (0.41 vs. 0.35 g/min). The ratio of fat to carbohydrates used for energy expenditure was also higher in the green tea group than in the placebo group.

Green tea extract, glucose tolerance and insulin sensitivity

In the second experiment, the participants took an oral glucose tolerance test. Before consuming 75 of glucose, half of the subjects took green tea capsules containing 890 mg of polyphenols of which 366 mg was epigallocatechin gallate, EGCG. The other half took a corn-flour placebo.

Plasma glucose concentrations after the oral glucose tolerance test were similar in the placebo and green tea extract groups. Serum insulin was significantly lower in the green tea group, however; the area under curve (AUC) was 15% smaller in those who had taken a green tea supplement before the test.

Conclusion

A green tea extract containing 890 mg polyphenols (catechins) increased fat oxidation from moderate-intensity exercise compared to placebo in healthy young men. Green tea extract also reduced insulin area under curve during a 2-hour oral glucose tolerance test and improved insulin sensitivity. Green tea may thus help with weight loss, both by increasing fat metabolism during exercise and maintaining healthy insulin levels.

For more information on green tea, see these posts:

Green Tea Extract Enhances Abdominal Fat Loss from Exercise
Peak Increase in Antioxidant Activity Occurs 20-40 Minutes after Drinking Green Tea
Green Tea, Black Tea & Oolong Tea Increase Insulin Activity by More than 1500%
Green Tea Reduces the Formation of AGEs

Read More......


Digg Technorati del.icio.us Stumbleupon Reddit Blinklist Furl Yahoo

Monday, March 30, 2009

Whitening Teeth & Healing Gums – Experiment Update

Drinking coffee and keeping teeth sparkling white can be a challenge.
Drinking coffee and keeping teeth sparkling white can be a challenge. (Photo by karpov)

This is an update on my oral health experiment, the one where I look for safe and effective ways to whiten teeth and keep gums healthy.

For the past months, I've been using a toothpaste called Beverly Hills Formula Natural White. It has several interesting ingredients such as coenzyme Q10 and green tea extract, both of which have been shown to have oral health benefits. The manufacturer's website also claims it's more effective in whitening teeth than other toothpastes.

As I mentioned in my previous post, one of the reasons I decided to take on this experiment was to prevent discoloration of teeth from coffee and tea – two beverages I've grown increasingly fond of. I've noticed that my teeth aren't as white as they used to be, and I assume tea and coffee have something to do with it. However, I enjoy both of them way too much to just drinking them, so I'd much rather experiment with toothpastes and various other things.

So what have the results been? Compared to when I started this experiment, there hasn't been any whitening or darkening in color. You could argue that this counts as a success, since I've drank coffee and tea throughout this time, but I argue otherwise. What I want to see is a whitening effect despite drinking coffee and tea, which Beverly Hills Formula Natural White failed to deliver.

That's something of a disappointment, since I think that a lot of the stuff in this toothpaste actually is good for teeth and gums – perhaps there's just not enough of the active ingredients to make a real difference. One pleasant outcome has been the lack of mouth ulcers during the past several months, though that might be due to something else entirely. In any case, it's time to move on.

My next toothpaste is Colgate's Sensation White. The magic behind this product are apparently its "micro-cleaning crystals", which may or may not be pure marketing nonsense. I guess we'll find out soon enough. Apart from the crystals, the rest of the ingredients look like they could be found in any average toothpaste.

I have to give credit to Colgate for including a color scale with the tube, though. Very handy for tracking success in teeth whitening.

For more information on dental health, see these posts:

Whitening Teeth & Healing Gums: In Search of the Perfect Toothpaste
Dental Health Effects of Green and Black Tea
The Role of Coenzyme Q10 in Oral Health
Preventing Mouth Ulcers with Tea Tree Oil Toothpaste - Results after Two Months

Read More......


Digg Technorati del.icio.us Stumbleupon Reddit Blinklist Furl Yahoo

Sunday, March 29, 2009

Coconut Oil Is Better than Olive Oil for Atopic Dermatitis

Coconut oil is effective in treating atopic dermatitis.
Coconut oil is effective in treating atopic dermatitis. (Photo by denn)

Atopic dermatitis is a skin condition in which the skin reacts easily to irritants and becomes red, dry, flaky and itchy. Atopic dermatitis is also characterized by a prevalence of a bacterium called Staphylococcus aureus (SA), which easily spreads and colonizes uninfected atopic skin. Early and proactive interventions with antiseptic lotions have been suggested for reducing SA colonization and thus dermatitis symptoms.

Some people swear by topical coconut oil in treating all sorts of skin disorders, including atopic dermatitis, but few studies have been done to test these claims. An interesting study by Verallo-Rowell et al. compared the effects of topical virgin olive oil and virgin coconut oil on people with atopic dermatitis. Both oils showed benefits, but in this case, virgin coconut oil was the clear winner.

The participants (aged 18 to 40 years) were randomly divided into two groups, with the first group given virgin olive oil and the other group given virgin coconut oil to be applied topically. The instructions read as follows:

On the affected areas that include the test sites, apply 5 mL of oil two times a day and massage gently but thoroughly into the skin for several seconds. Do not apply other emollients, creams, or oil-based products that can mask the effect of the oil.

Both groups included 26 people. SA cultures were collected with cotton swabs and analyzed before and after the 4-week study.

Coconut oil vs. olive oil: effect on Staphylococcus aureus colonization

20 of the 26 participants in the virgin coconut oil group had a positive SA culture at the beginning of the study. After four weeks of using the oil, only 1 subject remained positive; in other words, virgin coconut oil was effective in 95% of the participants.

In the virgin olive oil group, 12 of 26 participants tested positive at the beginning. At the end of the study, 6 of them tested positive. Thus, even though both oils reduced Staphylococcus aureus colonization in treated areas, virgin coconut oil was significantly more effective (50% vs. 95% improvement).

Coconut oil vs. olive oil: effect on atopic dermatitis severity

SCORAD ("SCORing Atopic Dermatitis") is a clinical tool for assessing the severity of atopic dermatitis. At the beginning of the study, both groups had similar SCORAD index scores. After four weeks, both groups had lower scores, with the scores of the virgin coconut oil users being even lower than those of the virgin olive oil users.


Virgin olive oil and atopic dermatitis
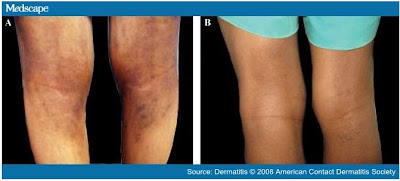
The image above shows an atopic dermatitis site before (A) and after (B) treatment with virgin coconut oil. The SCORAD index score in A is 35; in B, the score is 20. As you can see, the improvement is quite visible. Here's a quote from the paper:

The AD patients who were treated with virgin coconut oil in this study had significantly lower objective SCORAD scores for dryness and dryness-related conditions, such as excoriation and lichenification, and for erythema, edema, and papulation.

Conclusion

Topically applied virgin coconut oil reduced Staphylococcus aureus colonization in 95% of the patients, compared to 50% reduction from virgin olive oil. Coconut oil also improved atopic dermatitis severity scores more than olive oil. Twice a day application of virgin coconut oil may thus be helpful in treating atopic dermatitis.

For more information on skin and coconut oil, see these posts:

Bioactive Form of Silicon (BioSil) Improves Skin, Hair & Nails in Photoaged Women
Hyaluronic Acid for Skin & Hair – Experiment Conclusion
Coconut Lowers LDL, VLDL and Triglycerides, Raises HDL
Emu Oil and Hair Growth: A Critical Look at the Evidence

Read More......


Digg Technorati del.icio.us Stumbleupon Reddit Blinklist Furl Yahoo

Thursday, March 26, 2009

Increasing Intelligence by Playing a Memory Game – Experiment Update

Can exercising your brain increase your IQ score?
Can exercising your brain increase your IQ score? (Photo by hyperscholar)

This is an update on my intelligence experiment, in which I play a memory game to see if it increases my IQ test score.

In the original study related to this experiment, the participants played a memory game (called dual n-back) for 8-19 days and increased their IQ test scores more than the control group. This remarkable finding suggests that, unlike previously thought, it might be possible to increase one's general intelligence by exercising the brain.

When I began the experiment, I wrote that I would try to match the study as closely as possible. That is, I was supposed to take an IQ test, play the game for 20 days and then re-take the IQ test to see if it my results had improved. Of course, I had no control group, so I would just have to compare the scores and try to determine whether the increase in the score was significant enough to count as a genuine improvement.

That was two and a half months ago. I did play the game almost daily for the first 20 days, aiming to play 20 rounds each time, which was the number used in the study. After that, however, it occurred to me that if the game does increase one's intelligence, then playing it for even longer than 20 days should increase it even more, so there's really no point in limiting the experiment to 20 days, especially since I had no control group.

Also, since re-taking an IQ test usually results in a slightly better score each time, I thought it would make more sense to keep playing for a longer time and avoid re-taking the test after such a short while. This way, when I finally took the IQ test for the second time, the difference in scores should be even clearer.

After the 20 days, however, I've been somewhat lazy and haven't played the game as often as I did in the beginning. Nonetheless, there has been something of a trend in my game scores improving during these past two and a half months, so I've finally taken the IQ test again. But first, here are the dual n-back scores of the study participants:

Dual n-back scores
And here are my results:

My dual n-back scores
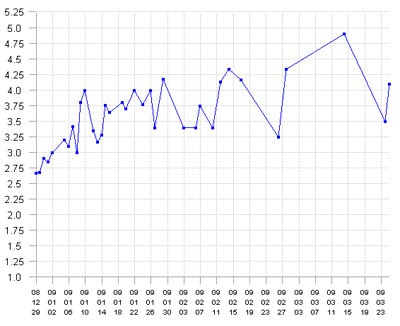
Believe it or not, the sudden drops in the graph are not due to periods of increased stupidity; rather, they're scores from days when I played only a few games for one reason or another. Since the game begins from level n=2 each day and the total score of the day is the average n of all rounds played, playing just a few rounds will result in a low score. There's no excuse for that last dot on the graph, however. I just played really badly!

The two graphs aren't entirely comparable, because the version of the game the participants in the study played was a little different than the one I played (though the study mode is available in the game, too, as I've later learned). Still, the increase in the score of the participants seems larger than mine, which means that either they were smarter and better than me, or they cheated and the study is completely flawed. Needless to say, I lean towards the latter option.

So what about the IQ tests? As I mentioned in the first post, the idea was to take two tests and compare the scores of both, so that I'd have a more reliable result. Unfortunately, I couldn't find the IQ test used in the study online, so I had to use what was available. In addition, the second test proved to be exactly the same on both times, so it wasn't of much use. It also gave me a much higher score than the other test, which casts further doubt on its validity.

The other test proved to be quite good (you can find it here). In this one, the questions vary, the difficulty is adjusted on the go depending on whether you answer them correctly, and there's a time limit of 45 seconds per question, which makes this test better suited for re-taking. My first test, taken before playing the game, gave me a score of 126; my second test, taken yesterday, gave me a score of 132 (an increase of about 5%).

This result is again not easily compared to the results from the study, because their test gave scores in the range of 9 to 12, whereas the one I took used 100 as a measure of an average intelligence. The control group saw an increase from ~9.5 to ~10.5 (an increase of about 15%), while the memory game group increased their score from ~9.5 to ~12 (an increase of about 25%).

As you can see, it's kind of difficult to draw any meaningful conclusions from this. Yes, there was a slight increase in my score, but I would say a similar increase could've been possible even without playing the game. I think the variation in the IQ test questions reduces the "learning by heart" effect, but that's impossible to say without a control group.

Since there's nothing to lose and possibly plenty to gain, I'm going to keep playing the game and re-take the IQ test after some more months. And if you know of any good IQ tests online, drop a comment and let me know!

For more information on brains and intelligence, see these posts:

Playing a Memory Game to Improve Intelligence and Increase Your IQ Score?
Caloric Restriction Improves Memory in the Elderly
Moderate and Severe Caloric Restriction Alter Behavior Differently in Rats
Intermittent Fasting Reduces Mitochondrial Damage and Lymphoma Incidence in Aged Mice

Read More......


Digg Technorati del.icio.us Stumbleupon Reddit Blinklist Furl Yahoo

Wednesday, March 25, 2009

Red Meat and Mortality: A Closer Look at the Evidence

Is red meat really bad for you? Perhaps not.
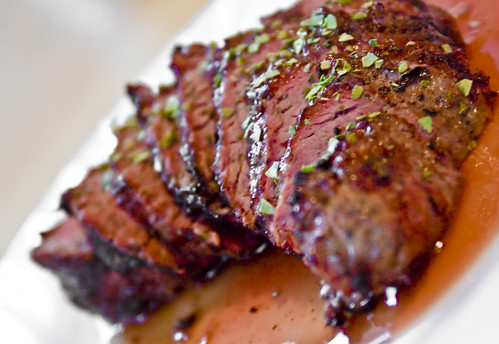
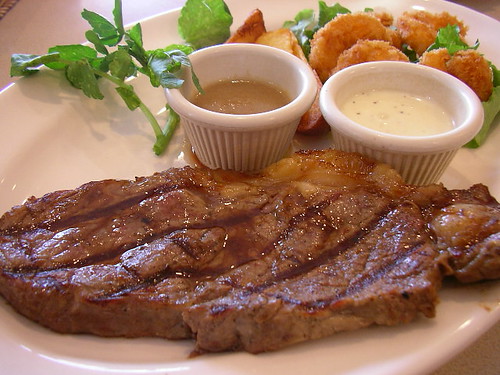
Is red meat really bad for you? Perhaps not. (Photo by TheBusyBrain)

If you've followed the news lately, you've probably seen the headlines warning you how red meat increases mortality. The media seems to love bashing on meat these days for some reason, but what about the cold hard facts? Is it really true that meat will increase your chance of dying?

To answer that, we'll have to look at the full paper by Sinha et al. and see what they had to say. The study included over half a million people, both men and women, which is a pretty impressive number. The participants' lifestyle characteristics (including dietary habits) and deaths from various causes were followed for 10 years. The results led the authors to the following conclusion:

Red and processed meat intakes were associated with modest increases in total mortality, cancer mortality, and cardiovascular disease mortality.

This, in turn, led the media to the conclusion that eating steak might kill you any minute. To see if that's true, a closer look the study and the results is in order.

Red meat and mortality: correlation or causation?

The first problem with epidemiological studies is that there may be other, unknown factors at work which skew the results and obscure the big picture. These factors are known as confounding variables. For example, if people who eat lots of meat get cancer more often than those who don't eat meat, one explanation could be that meat causes cancer. However, it could also be the case that people who eat meat simply tend to be overweight, and that obesity is what is causing cancer in these people.

To rule out this possibility, the authors looked at the data to find out the variables that correlate with meat consumption and mortality. Sure enough, there were many such variables. People who ate more red meat and processed meat also smoked more, ate more, weighed more, exercised less and were less educated – all of these factors are known to be associated with increased mortality.

The authors then adjusted for the effects of these variables to see if red meat and processed meat eating alone correlated with mortality. Even though the correlation was now weaker, the positive correlation still remained. In other words, regardless of whether the people were overweight, smoked, or exercised, eating red meat and processed meat still seemed to increase their risk of dying.

So does this mean that red meat and processed meat eating causes death? Maybe. The results certainly don't rule out the possibility of causation, but they also doesn't prove it. The confounding variables that the authors adjusted for may not be all the confounding variables. They only looked at the variables included in the questionnaire – smoking, exercise, education, etc. – but that's not to say that there couldn't have been other factors at play.

For example, perhaps the meat eaters also ate more processed carbs. The data doesn't say, so there's no way of knowing. But since we already know that meat eaters exercise less, smoke more, and generally live less healthy lives, it's not unreasonable to assume that they might also be the ones who order their steaks with french fries instead of salad.

Red meat, processed meat and white meat: what do they include?

Even if we accept the claim that red meat causes an increase in mortality, there is another big problem with the study that has to do with definitions. What exactly do the terms red meat, processed meat and white meat mean in this context?

Usually, red meat simply means any meat that is red in color when it's raw, whereas white meat is meat that is, well, whitish – or at least not as red as red meat (the difference in color depends on the amount of myoglobin in the muscle). So things like beef and lamb are considered red meat, while pork and chicken are considered white meat. Processed meat is a bit more ambiguous, but it usually means meat preserved by smoking, curing, salting, or by adding preservatives. This category includes foods like bacon, ham and sausages.

Now, if you were to think that these definitions are what the authors used in their study, you'd be sorely mistaken. The red meat category used in the questionnaire included the following items:

All types of beef and pork, including bacon, beef, cold cuts, ham, hamburger, hotdogs, liver, pork, sausage, steak, and meats in foods such as pizza, chili, lasagna, and stew.

White meat was considered to be any of the following:

Chicken, turkey, fish, including poultry cold cuts, chicken mixtures, canned tuna, and low-fat sausages and low-fat hotdogs made from poultry.

Finally, here's the list for processed meat:

Bacon, red meat sausage, poultry sausage, luncheon meats (red and white meat), cold cuts (red and white meat), ham, regular hotdogs and low-fat hotdogs made from poultry.

What does this mean? It means that red meat not only includes beef steaks and pork, but also processed foods like bacon, hotdogs, sausages, and even meat in foods like pizza. So perhaps the problem is not red meat per se, but processed red meat? Again, there's no way to tell based on the data, since the authors didn't make a distinction between the two. However, since processed meat – using the authors' definition – did correlate with increased mortality, this seems like a valid hypothesis.

In addition, since most pizzas have some kind of meat on them, those participants who ate a lot of pizza were likely included in the quintiles eating more meat than those who didn't eat pizza. But if the pizza eaters die younger, is the problem the meat in the pizza or the pizza itself? Should we blame the toppings or the dough? The idea that there could be another culprit to explain the increased mortality sure begins to seem plausible.

If red meat is bad, why is white meat good?

The result that took the authors by surprise is that white meat, unlike it's bad cousin red meat, actually reduced total mortality and cancer mortality. For cardiovascular disease deaths, there was only a slight increase. For death from injuries and sudden death, no association was found.

So is there something in red meat that is lacking in white meat that kills people? One possibility is the higher iron content of red meat, which might be a problem, especially during later age. The theory of mineral accumulation causing aging is certainly interesting, but I would like to see further studies before drawing any conclusions.

The authors could've taken the usual route and shifted some of the blame on saturated fat, but instead, they don't offer any explanation on why red meat and processed meat is bad but white meat is good. My guess is that maybe it's not red meat in general that is the problem here, but processed red meat – foods like hotdogs, bacon, etc.

In fact, I would go so far as to say that the problem might be any processed meat, be it red or white. This would help explain why poultry hotdogs and pork hotdogs were among the foods associated with increased mortality, but unprocessed poultry was not. I assume the only reason processed meat resulted in a seemingly smaller increase in mortality than red meat was that the amount of processed meat by the participants was smaller. Hotdog eaters having less cancer incidences than rare steak eaters would be a truly surprising result.

Thus, perhaps it's less about the color of the meat and more about amount of processing, at least in this study. Cooking alone, for example, causes the formation of advanced glycation end products (AGEs), and the difference in terms of harmful side products between cooking a medium steak and eating a processed hotdog is probably quite big.

Conclusion

All in all, I don't think this study tells us much about the potential risks of eating meat. The main problems with this study are:

1) The possibility of unknown confounding variables that might explain the increased mortality from red meat and processed meat consumption. For example, the amount and type of carbohydrates eaten by the participants was not measured by the questionnaire.

2) The fact that the red meat category included foods such as pork, bacon, sausage, hotdogs, and pizza toppings, i.e. foods not usually considered red meat and also processed meats. Therefore, it is unclear whether the association was due to processed red meat instead of red meat per se.

3) The inverse relationship between white meat and mortality. Those who consumed foods categorized as white meat had less risk of cancer and total mortality. It is not apparent why red meat would increase risk while white meat would decrease it. Again, one possible explanation is that the white meat category included less processed foods than the red meat category.

For more information on diets and health, see the following posts:

Low-Carb vs. Low-Fat: Effects on Weight Loss and Cholesterol in Overweight Men
Intermittent Fasting: Understanding the Hunger Cycle
Caloric Restriction Improves Memory in the Elderly
A Typical Paleolithic High-Fat, Low-Carb Meal of an Intermittent Faster

Read More......


Digg Technorati del.icio.us Stumbleupon Reddit Blinklist Furl Yahoo

Tuesday, March 24, 2009

Green Tea Protects from Bone Loss in Female Rats

Green tea may protect women from osteoporosis.
Green tea may protect women from osteoporosis. (Photo by René Ehrhardt)

Osteoporosis is a common problem in middle-aged women. It is characterized by a thinning of bones and increased fracture risk. While it's common for bones to lose some of their strength with age, menopause adds considerably to the problem. This is thought to be due to an insufficiency in estrogen levels after menopause.

According to a paper by Shen et al., green tea may be effective in preventing bone loss associated with age and estrogen deficiency. They fed green tea to ovariectomized (which means the surgical removal of ovaries) and aged rats and noticed that their bones were in better shape than those of rats fed with water. Ovariectomized rats are often used as an animal model of postmenopausal osteoporosis. These rats are deficient in estrogen and have an increased bone loss similar to women after menopause.

The female rats were first divided into two groups: the non-ovariectomized ("premenopausal") and ovariectomized ("postmenopausal") group. Each group was given water only or green tea polyphenols mixed with drinking water in a 0.1% or 0.5% concentration. The purity of the polyphenol extract was higher than 80%, meaning that at least 80% of the content was catechins. Once again, the most abundant catechin was epigallocatechin gallate (EGCG).

Green tea and bone loss in non-ovariectomized ("premenopausal") female rats

After 16 weeks, the water-only control group had lost a significant amount of bone mineral content (BMC) compared to baseline (408 --> 382 mg). The loss of bone mineral content in the 0.1% green tea polyphenol (GTP) group was not statistically significant compared to baseline (408 --> 403 mg) but was significant compared to the control group (403 vs. 382 mg).

The 0.5% GTP group actually had an increase in bone mineral content compared to baseline (408 --> 417 mg), but this was not statistically significant. Compared to the loss seen in the control group (408 vs. 382 mg), however, the difference was statistically significant.

Bone mineral density (BMD) also significantly decreased in the control group (243 --> 228 mg/cm^2). The 0.1% GTP rats lost less bone mineral density (243 --> 236 mg/cm^2) than the control group, while the 0.5% GTP retained their BMD.

Green tea and bone loss in ovariectomized ("postmenopausal") female rats

Unsurprisingly, the ovariectomized rats lost even more BMC than the non-ovariectomized rats. The decrease was greatest in the control rats (408 --> 339 mg). This time green tea polyphenols in drinking water failed to significantly slow the loss. In the 0.1% GTP group, the loss was slightly greater (408 --> 347 mg) than in the 0.5% GTP group (408 --> 352 mg), but the difference was not statistically significant.

BMD also decreased more than in the non-ovariectomized rats, with the control group showing the biggest loss (243 --> 198 mg/cm^2). Compared to the control group, the 0.1% GTP group retained significantly more bone mineral density (204 vs. 198 mg/cm^2), as did the 0.5% GTP group (206 vs 198 mg/cm^2).

Conclusion

Estrogen deficiency and aging together resulted in a greater loss of bone mineral content and bone mineral density in female rats than aging alone. Green tea polyphenols attenuated the loss in a dose-dependent manner. The protective effect of green tea was greater in female rats without estrogen deficiency.

Green tea extract was given to rats in a 0.1% or 0.5% concentration (>80% catechin content) in drinking water. According to the authors, this is equivalent to 1 and 4 cups of green tea in humans, respectively.

For more information on green tea, see these posts:

Green Tea Protects from Arthritis in Rats
Vitamin C Protects Green Tea Catechins from Degradation
Green Tea Protects Cartilage from Arthritis in Vitro
Green Tea Extract Enhances Abdominal Fat Loss from Exercise

Read More......


Digg Technorati del.icio.us Stumbleupon Reddit Blinklist Furl Yahoo

Monday, March 23, 2009

Intermittent Fasting: Understanding the Hunger Cycle

Intermittent Fasting: Understanding the Hunger Cycle
Coffee can be your foe and your ally during a fast. (Photo by DeusXFlorida)

In this update on my intermittent fasting experiment, I will share some of my experiences with hunger. If you're interested in giving fasting a go but doubtful whether you can live with the hunger, you may find the following information useful.

For those who haven't read my previous update, here's a quick recap. For the past eight months now, my eating schedule has been a cycle of 24 hours of eating followed by 24 hours of fasting. This diet is known as intermittent fasting (IF) or alternate-day feeding (ADF). In case you're wondering why anyone would willingly restrict their eating, see my posts on intermittent fasting and caloric restriction.

After trying a few variations, the point where I either start or break the fast has naturally gravitated towards 6 PM. On the days when the first part of the day consists of eating and the second part of fasting, this allows me to eat one more meal at home after work before beginning the fast. While making it without food to 6 PM is somewhat more difficult than to, say, 4 PM, it's not impossible at all. Hence, six o'clock seems like a good compromise.

I've followed the diet cycle pretty strictly, but I don't stress it if my schedule doesn't fit with a fast. For example, if I know I'm going out for dinner, I might switch the fasting days with the eating days or adjust the time by a few hours. Sometimes on weekend nights, I've also had fasts where I don't eat anything but do drink alcohol (which I like to call intermittent fasting with beer, or IFB). The bad part is the seemingly illogical "how come I'm consuming liquid energy but keep feeling hungrier" sensation; the good part is that you get a buzz from drinking much less.

These months of various degrees of hunger and satiety have taught me a few things about fasting I'd like to share. I assume most people are reluctant to try IF because they're afraid they won't be able to endure the hunger. However, I can honestly say that after the first few weeks, the hunger is really not that bad.

There is also a smaller cycle within the larger cycle of eating and fasting; namely, what I like to call "the hunger cycle". What the hunger cycle means is that the feeling of hunger during the 24-hour fast is not constant but fluctuates as time progresses. In my experience, the variation is not random. Instead, there's a clear pattern that becomes evident after a while. Knowing this pattern can be very helpful when you're doing or thinking about doing intermittent fasting.

Fasting hours 1-4: 6 PM - 10 PM

My last meal (sounds more dramatic than it is) before the fast is usually big enough to keep hunger away for several hours. In fact, I make it a point to eat a lot right before the fast for precisely this reason, so it's hardly surprising that the first four hours pose little problems in terms of hunger. I also drink a few cups green tea or black tea right after the meal both to keep insulin levels healthy and in anticipation of the next few hours.

Fasting hours 4-8: from 10 PM to 2 AM

During the four hours before bedtime I get the first small cravings. Since I know I've already consumed my daily calories, I can easily tell that what I'm feeling is not real hunger but a slight psychological craving to eat something. Dark chocolate especially seems like a good idea at this point. Although I avoid drinking tea this late, the few cups from earlier seem to carry over their slight hunger-reducing effect a little and help create a fuller feeling. Water is also good.

Fasting hours 8-15: from 2 AM to 9 AM

This is when I get my sleep on. No problems with hunger here.

Fasting hours 15-17: from 9 AM to 11 AM

Interestingly, when I wake up, the cravings from the previous night have usually disappeared, so skipping breakfast is no big deal. I usually also feel very energetic at this point, even though I never used to consider myself a morning person. When I get to work, I drink a cup of coffee and almost always feel a noticeable lift in mood. The high energy level and good mood are not accompanied by feelings of hunger, which makes this one of the best and most creative periods of the fast.

Fasting hours 17-19: from 11 AM to 1 PM

Here's when hunger makes its appearance. Energy level is still pretty high, but looking at colleagues having their lunch really makes the stomach growl. I don't feel fatiqued at this point, but food seems really tempting. Nonetheless, this is still a period in which to get things done.

Fasting hour 19-20: from 1 PM to 2 PM

The dreaded 20th hour arrives. Even though I wouldn't pass on an offer for late lunch here, the cravings are less pronounced than a few hours earlier. The hunger is replaced by a strange brain fog and general lack of energy. Things that require concentration become difficult, and I often find myself staring blankly at the screen. I usually drink a cup of green tea, but it's of little use. Coffee is not a good idea, because instead of having the mood-lifting and energy-giving effect of the morning cup, caffeine will only make the dizziness worse.

Fasting hour 20-24: from 2 PM to 6 PM

The fog gradually lifts, with the feeling of hunger making a comeback (though this time it's more of a cameo appearance than a leading role) and energy levels increasing again. This is another very nice period that gets better and better towards the end of the fast. Creativity seems to increase, and there's a general feeling of lightness.

What's funny is that right before it's time to finally break the fast and eat again, it feels like continuing the fast would be quite easy. And in fact, sometimes when I have continued it into the 24-26 hour range to adjust the schedule, I've felt very good. The reason I don't usually fast for more than 24 hours is because I would have to keep adjusting the point where I start or stop eating. And of course, when the first meal of the day is in front of me, I'm glad that the fast is over.

Conclusion

The feelings of hunger during intermittent (24 hour) fasting vary with time. The one thing to keep in mind is that, in my experience, the most difficult part is near the 20th hour into the fast. That's when the hunger is replaced by a general lack of energy and focus. This feeling will, however, pass in an hour or so, after which fasting becomes much easier again.

For more information on intermittent fasting, see these posts:

Intermittent Fasting with a Condensed Eating Window – Part I: Poorer Insulin Sensitivity and Glucose Tolerance?
Intermittent Fasting Reduces Mitochondrial Damage and Lymphoma Incidence in Aged Mice
A Typical Paleolithic High-Fat, Low-Carb Meal of an Intermittent Faster
Intermittent Fasting Improves Insulin Sensitivity Even without Weight Loss

Read More......


Digg Technorati del.icio.us Stumbleupon Reddit Blinklist Furl Yahoo

Sunday, March 22, 2009

Caloric Restriction Improves Memory in the Elderly

Eating less may help with delaying Alzheimer's disease
Eating less may help with delaying Alzheimer's disease. (Photo by patrickeaster)

The good news for caloric restriction just keeps coming. While optimal anti-aging benefits may require starting caloric restriction during early adulthood, good things will apparently come to those who cut their calorie intake after middle age too.

One of those things seems to be an improvement in maintaining brain function. That's very exciting, because memory impairment is an indication of Alzheimer's disease, which is a big problem among the aging population. In their study, Witte et al. compared the effects of calorie restriction (CR) and increased unsaturated fatty acid (UFA) intake on memory in the elderly. They found that eating less was more effective in improving memory scores than eating more unsaturated fatty acids.

Study participants and methods

The participants were 50 healthy, normal- to overweight elderly men and women, with a mean age of 60.5 years. They were divided into three groups: the calorie-restricted group, the unsaturated fatty acid group, and the control group.

The CR group was instructed to eat 30% less than their normal energy intake. Minimal intake was set to 1,200 kcal per day to avoid malnutrition. The UFA group was told to increase their unsaturated fatty intake by 20% but keep total fat intake unchanged (i.e. they also reduced their saturated fat intake by 20%). The participants in the control group were instructed to follow their usual diets. The experiment lasted for 3 months.

Neuropsychological testing was done using the Rey Auditori Verbal Learning Task, which measures the ability to memorize words. The participants were asked to learn as many words as possible from a list of 15 words and then correctly recall them after 30 minutes.

Results

The participants reported on a postintervention questionnaire that they followed the dietary guidelines successfully. The CR group reduced their calories and lost weight, whereas the UFA and control groups tended to gain weight. The ratio of unsaturated-to-saturated fat intake more than doubled in the UFA group, with most of the new unsaturated fats being polyunsaturated.


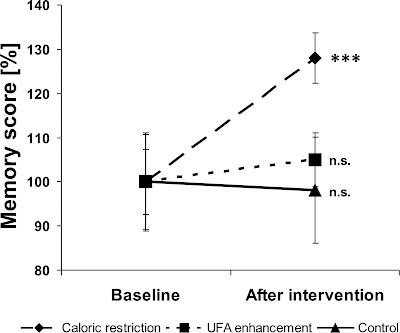
Calorie restriction vs. unsaturated fat intake: effect on memory

The figure above shows that only the CR group significantly increased their memory scores, showing an improvement of 30%. The UFA and control group did not show a significant change in their ability to recall words correctly. The authors speculate that the lack of improvement in the UFA group might have been due to the participants consuming very little marine sources of omega-3 unsaturated fatty acids, which have been suggested to improve brain function.

Conclusion

Healthy, elderly subjects (normal to overweight) on a calorie restriction diet showed a 30% increase in memory scores compared to a control group. Replacing saturated fats with polyunsaturated fats did not result in similar changes.

For more information on caloric restriction, see these posts:

Anti-Aging in the Media: National Post on Caloric Restriction
Moderate and Severe Caloric Restriction Alter Behavior Differently in Rats
Anti-Aging in the Media: Houston Press on Caloric Restriction
A Week of Caloric Restriction - Experiment Begins

Read More......


Digg Technorati del.icio.us Stumbleupon Reddit Blinklist Furl Yahoo

Thursday, March 19, 2009

Anti-Aging in the Media: National Post on Caloric Restriction

Caloric restriction: condition yourself to eat less
Caloric restriction: condition yourself to eat less. (Photo by oskay)

One more mainstream newspaper has discovered the secrets of caloric restriction. Following on the trails of Houston Press, who ran an article on caloric restriction and resveratrol last month, it's now National Post's turn to take a walk on the light side.

The story, with the less than exciting headline "Eat less, live longer", takes a somewhat different approach than many of the others we've seen so far. There's no interview with anyone doing calorie restriction, for one. Just some basic facts for those who might be tempted to trade their cheeseburgers for some extra years of life:

As early as the 1930s, it was shown that calorie reduction could double the lifespan of rats. What's more, a 1988 study noted that mice on a calorie-restricted diet had a more youthful appearance, a higher activity level and a delay in age-related diseases, compared with those on an unrestricted feeding schedule.

While the overall tone of the article is quite positive, some mandatory health warnings regarding cutting back on calories are also included:

In addition, it is known that excessive fasting may lead to anemia, muscle wasting, dizziness, fatigue, nausea and depression, among other symptoms and conditions. Even the Calorie Restriction Society warns that a reduction in nutrition may lead to bone and muscle loss, increased cold sensitivity, disrupted menstrual cycles, reduced athletic performance and decreased sex drive.


I think this is pushing it a little, since anemia, muscle wasting, dizziness, nausea and depression are not common symptoms of caloric restriction. Rather, they're symptoms of malnourishment, which is of course not the goal of CR – that's why it's often called CRON, from Calorie Restriction with Optimal Nutrition.

The rest of the issues are, however, quite real. But then, that's a trade-off some are willing to make in order to increase their lifespan. If you're young and athletic, seriously reducing your energy intake may not seem so appealing, but for those worried about aging-related diseases like Alzheimer's, caloric restriction might be an option to consider. The article mentions a study on elderly volunteers comparing the effects of omega-3 fatty acids and CR on memory:

Remarkably, the patients who were assigned to calorie restriction demonstrated marked improvement in memory, while those trying to increase their unsaturated fatty acid intake and those who maintained their usual diet showed no change. The researchers also took blood samples from all the study participants; the low-calorie group saw a reduction in their insulin and C-reactive protein levels.

So if you keep forgetting to eat your breakfast, you may actually be doing yourself some good. Speaking of memory, I don't recall ever reading anything about this one before:

The first studies on the effects of caloric reduction on humans were done in the 1940s, when it was observed that Scandinavians, living on a diet in which their calories were restricted by 20% because of the hardships of the Second World War, showed a decrease in cardiovascular disease.

Unfortunately, there's no source for this claim. I may have to do some digging to find out if it's true. Even though old studies on caloric restriction usually include plain starvation (as in malnourishment), they provide an interesting look on the subject anyway.

For more information on aging, see these posts:

Anti-Aging in the Media: Vancouver Sun on Immortality
Intermittent Fasting Reduces Mitochondrial Damage and Lymphoma Incidence in Aged Mice
Anti-Aging in the Media: Rolling Stone on Ray Kurzweil
Anti-Aging in the Media: 60 Minutes on Resveratrol

Read More......


Digg Technorati del.icio.us Stumbleupon Reddit Blinklist Furl Yahoo

Wednesday, March 18, 2009

Bioactive Form of Silicon (BioSil) Improves Skin, Hair & Nails in Photoaged Women

Bioactive Form of Silicon (BioSil) Improves Skin, Hair & Nails in Photoaged Women
Cherries are one of the food sources of silicon. (Photo by ali edwards)

Silicon is often marketed as a supplement for increasing hair and nail thickness and reducing wrinkles. However, while silicon has been shown to play an important part in healthy tissue formation, the trouble with silicon is that it's very poorly absorbed in most forms. So there is a big gap between theory and practice when it comes to taking silicon supplements.

Soluble silicon is present as orthosilicic acid in water and beverages. Orthosilicic acid itself is absorbed well, but it polymerizes easily into various silica species, which are not absorbed. For example, even though horsetail is rich in silicon, the silicon is an polymerized form which the body cannot use.

Bioavailable and stable form of silicon

So how to solve this dilemma? Enter choline-stabilized orthosilicic acid (ch-OSA). As the name implies, this form of silicon is both bioavailable (since it's orthosilicic acid) and does not polymerize easily (since it's stabilized with choline). It's used in products like Natrol's BioSil (formerly sold under the Jarrow Formulas brand).

BioSil seems to have a pretty good reputation on various health forums, especially regarding its effects on skin, hair and nails. As I've learned by experimenting on myself, positive reviews many times do not translate to any tangible results, and are likely due to the difficulty of making objective evaluations.

However, BioSil has something more than just anecdotal evidence behind it: namely, a study by Barel et al. published in 2005. They gave fifty women between 40 and 65 years with photodamaged skin either 10 mg of silicon in the form of ch-OSA or a placebo. After 20 weeks of oral administration, changes in skin quality and brittleness of hair and nails was evaluated.

Study design

Hair and nail brittleness was evaluated on four point scale with "zero" meaning no brittleness and "three" meaning severe brittleness. Skin roughness was measured a skin visiometer using three different parameters: depth of roughness, mean depth of roughness and maximum roughness (which sounds more like a Wrestling show than a measure of skin quality). Skin photoageing was evaluated by measuring the visco-elasticity of forehead skin.

Effects on skin quality

Depth of roughness, mean depth of roughness and maximum roughness increased in the placebo group by 8, 6 and 11%, respectively. In other words, their skin got worse during the 20 weeks. In the treatment group, however, the same parameters decreased by 16, 8 and 19%, meaning that the participants' skin quality improved considerably. Similarly, signs of photoaging increased in the placebo group but decreased in the group taking ch-OSA.

Effects on hair and nail strength

Both groups showed "slight" nail brittleness at baseline. No change was seen in the placebo group, while in the orthosilicic acid group nail brittleness decreased. Hair brittleness decreased slightly in the placebo group, but this change was not statistically significant. However, in the treatment group, the decrease was significant.


Silicon and strength of hair and nails
The authors also took blood samples before and after the experiment. No adverse effects were seen in either group. In fact, the only thing that showed a marked difference in blood samples was the serum level of silicon which was almost doubled in those who were taking orthosilicic acid. Thus, it appears that 10 mg of ch-OSA is both safe and effective.

Conclusion

Choline-stabilized orthosilicic acid, ch-OSA, is a bioavailable form of silicon. Middle-aged women with photodamaged skin showed significant improvements in skin, hair and nail quality after taking 10 mg of ch-OSA for 20 weeks compared to placebo.

My human experiment

Since these results are just too good not to attempt to duplicate them, as my next human experiment, I'm going to be taking 5 mg of orthosilicic acid in the form of Natrol's liquid BioSil product (use coupon code 'NEN423' for a $5 discount on first orders). Though it's only half the dose used in this study, it's the amount suggested for skin, hair and nails on the product label. If there are no results, I will increase the dose to 10 mg.

For more information on hair, skin and nails, see these posts:

Hyaluronic Acid for Skin & Hair – Experiment Conclusion
Emu Oil and Hair Growth: A Critical Look at the Evidence
How to Get Natural Sun Protection by Eating the Right Foods
3 Quick Ways to Find Out Whether Your Hair Growth Product Is Working

Read More......


Digg Technorati del.icio.us Stumbleupon Reddit Blinklist Furl Yahoo

Tuesday, March 17, 2009

Low-Carb vs. Low-Fat: Effects on Weight Loss and Cholesterol in Overweight Men

Eating steak instead of carbohydrates seems to be good for cholesterol
Eating steak instead of carbohydrates seems to be good for cholesterol. (Photo by jetalone)

These days pretty much everyone knows that the easiest way to lose weight is to cut down on carbohydrates. The reason why the Atkins diet is so popular is because it works. Since, however, the rest of the effects of a low-carb diet on health markers are less clear, it's worthwhile to look at some of things that happen in the body when you reduce your carb intake.

I think warning against low-fat diets on a health blog is sort of preaching to the choir, but if there's still someone out there contemplating whether to eat less fats or carbohydrates, this study by Sharman et al. is for you. The authors put overweight men on a 6-week low-fat diet and a 6-week very low-carbohydrate diet and looked at changes in their lipid levels.

Study participants and diet composition

The participants were 15 overweight but otherwise healthy men with body fat percentages over 25%. Mean age was 33.2, and mean BMI was 34.3. Fat intake before the two diet experiments was 29-42% of total energy. The participants were randomly divided into two groups, with one following the low-fat diet for 6 weeks and then the low-carb diet for 6 weeks, and the other group doing the same but in reverse order.

The low-fat diet was composed of ~20% protein, ~25% fat, and ~55% carbohydrates (of total energy intake). It also contained less than 10% of total calories as saturated fat, which should make the bacon-fearing food pyramid folks more than happy.

The low-carb diet, on the other hand, was composed of ~30% protein, ~60% fat, and ~10% carbohydrates. There were no restrictions on the type of fat consumed. Foods most commonly consumed on this diet included beef, poultry, fish, oils, nuts, seeds, and peanut butter. Vegetables, salads, cheese, eggs, and protein powder were eaten in moderation. All the subjects were in ketosis throughout the low-carb diet period, as confirmed by urine samples (mean carbohydrate intake was only 36 grams).

Weight loss

Before the experiments, mean energy intake was ~2590 kcal daily. During the 6-week low-fat diet, energy intake was reduced to ~1560 kcal daily. As a result, participants lost 3.9 kg on average. During the low-carb diet, energy intake was ~1860 kcal, but the subjects actually lost more weight as a result, with average loss during this period being 6.1 kg (I wonder how the "a calorie is a calorie" folks are going explain that one!)

Insulin levels

Serum insulin and insulin resistance were reduced to the same extent (~40% and ~30%, respectively) by both diets. This was probably mostly due to eating less, especially on the low-fat diet. I suspect that if their energy intake had been higher, insulin levels would've been better during the low-carb diet than the low-fat diet.

Cholesterol levels

Total cholesterol was reduced by 15% during the low-fat diet and by 11% during the low-carb diet, with no difference in the extent of the decrease. LDL was significantly reduced only by the low-fat diet. HDL was not affected. Triglycerides and the ratio of triglycerides to HDL were reduced only by the low-carb diet, with decreases of 44% and 42%, respectively. Pretty impressive figures.

Lipoprotein fractions did not change significantly on the low-fat diet. However, during the low-carb diet, relative percentages and concentration of the larger LDL-1 fraction increased and those of the smaller LDL-3 and LDL-4 particles decreased. Similarly, VLDL levels did not change during the low-fat diet but decreased during the low-carb diet.

Since triglyceride levels, VLDL levels, and the size of the LDL particles (smaller being worse) area lot more important than total cholesterol or LDL in determining cardiovascular disease risk, low-carb clearly performed better here than the low-fat diet.

Conclusion

In a balanced, randomized, cross-over study comparing two 6-week hypocaloric diets, overweight men showed more favourable changes in health markers during the very low-carb diet than the low-fat diet. As the low-carb diet only contained 36 grams of carbohydrates on average, the subjects were in ketosis throughout one of the two 6-week periods.

Despite eating more during the low-carb diet than during the low-fat diet, the subjects lost more weight. Insulin levels were improved during both diets. LDL was reduced only by the low-fat diet, while triglycerides, VLDL and LDL particle size were improved only by the low-carb diet. HDL was unaffected. Since these markers are important in determining cardiovascular risk, very low-carb diets appear safe and more beneficial than low-fat diets in individuals with metabolic syndrome.

For more information on diets and health, see these posts:

Intermittent Fasting with a Condensed Eating Window – Part I: Poorer Insulin Sensitivity and Glucose Tolerance
Anti-Aging in the Media: Houston Press on Caloric Restriction
A Typical Paleolithic High-Fat, Low-Carb Meal of an Intermittent Faster
7 Human Experiments of 2008 – Year in Review

Read More......


Digg Technorati del.icio.us Stumbleupon Reddit Blinklist Furl Yahoo

Monday, March 16, 2009

Green Tea Protects from Arthritis in Rats

Could green tea be a treatment for arthritis in humans?
Could green tea be a treatment for arthritis in humans? (Photo by nyki_m)

I wrote a while ago about a study showing that green tea protects from arthritic cartilage breakdown in vitro. As promising as in vitro studies are, they're not the same thing as testing something on whole organisms. For example, based on that study alone, it's difficult to determine how much green tea would be needed to see effects in animals or humans – or indeed, whether it even works in vivo.

But fear not: the above study is not the only piece in the puzzle. According to a paper by Kim et al., green tea extract is effective in protecting rats from arthritis. Rats with bacteria-induced autoimmune arthritis showed less signs of arthritis when they were given green tea in drinking water.

Study design

The green tea extract used by the authors contained 57.5% catechins (of total weight), of which the most abundant one was epigallocatechin gallate (EGCG). The first group of rats received 8 grams of the extract per liter of drinking water, the second group received 12 grams, and the control group received normal water.

Each group was fed for 1-3 weeks before arthritis was induced. The severity of arthritis was evaluated on the basis of erythema (redness of the skin caused by capillary congestion) and swelling in each paw.

Effect of green tea extract on arthritic symptoms

The groups receiving 8 g/L had less signs of arthritis than the control group. The rats that had received green tea in drinking water for 2 weeks showed much less symptoms compared to rats fed for only 1 week. However, 3 weeks of 8 g/L feeding wasn't more effective than 2 weeks; in fact, it was less effective, although the difference was very small.

A similar pattern was observed with the size of the dose. When the duration of the treatment was 2 weeks, the rats fed 8 grams of green tea extract per liter had less arthritis than rats fed 12 grams. In the group fed for 3 weeks, there was no clear difference.

Even though the data for lower doses of 2 and 4 g/L is not presented, the authors mention that when all the arthritis scores from different doses were compared, 8 g/L and 2 weeks of feeding was the optimal combination, with the scores following an inverted bell-shaped dose-response curve.

Effect of green tea extract on cytokines and inflammation

Green tea extract suppressed the proinflammatory cytokine IL-7. Of the anti-inflammatory cytokines IL-4 was unaffected while IL-10 was increased. Other studies have shown that the suppression of IL-7 and induction of IL-4 and IL-10 can prevent or alleviate arthritic conditions, which makes green tea look quite promising in the treatment of arthritis.

Conclusion and practical considerations

An extract of green tea added to drinking water reduced signs of bacterially induced arthritis in rats. The results are explained in part by green tea's ability to suppress the proinflammatory cytokine IL-7 while increasing the secretion of the anti-inflammatory cytokine IL-10.

The optimal dose in this study was found to be 8 grams of extract per liter of drinking water for 2 weeks before inducing arthritis. The amount of catechins per gram of extract was 57.5%, which gives 4.6 g catechins in a liter of drinking water. If we assume that the rats drank about 50 mL per day, this would amount to an intake of 0.23 g (or 230 mg) of catechins per day.

The catechin content of green tea varies, but assuming a conservative estimate of 100 mg per cup, the amount in the study would be equivalent to about 2-3 cups per day. Keep in mind, however, that this is a very rough figure – the amounts that work in rats may not work in humans.

For more information on green tea, see these posts:

Vitamin C Protects Green Tea Catechins from Degradation
Green Tea Protects Cartilage from Arthritis in Vitro
Green Tea Extract Enhances Abdominal Fat Loss from Exercise
Caffeine and Polyphenol Contents of Green Tea, Black Tea, Oolong Tea & Pu-erh Tea

Read More......

Digg Technorati del.icio.us Stumbleupon Reddit Blinklist Furl Yahoo

Sunday, March 15, 2009

Anti-Aging in the Media: Vancouver Sun on Immortality

Anti-Aging in the Media: Vancouver Sun on Immortality
Cemeteries: a thing of the past in the future? (Photo by RickC)

Well, folks, something that was almost unthinkable not so long ago has finally happened: A major newspaper has published a serious column on immortality. Not caloric restriction, not resveratrol, not adding-a-few-healthy-years by eating well and exercising, but good old fashioned immortality of the just-not-dying sort.

The column, which appeared in Vancouver Sun (see this link for a few corrections), is a significant step forward in getting the word out on the scientific conquest of death, especially death resulting from aging. While I think that even the more pessimistic articles are good publicity at this point, this piece is especially noteworthy because it's neutral at worst and actually positive at best.

Many people still feel that stopping the destructive biological disease known as aging is impossible to defeat. This, however, is due in large part to the fact that most people have never really stopped to think about it. If they looked at some of the amazing things we can do now and some of the things we'll be able to do in the near future, they'd likely have a much more optimistic attitude. Here's a quote from the writer of the column, Stephen Hume:

We don’t blink at new hip joints, transplanted heart valves or minuscule plastic lenses that unfold inside the eye like flowers following cataract surgery, longevity advocates argue, so what’s surprising about the looming possibility of even more extensive and complex replacements?

That's a question everybody who doesn't think extending human lifespan by more than a few years is possible should ask themselves. There is nothing inherently impossible in slowing down and eventually stopping the aging process; it's just that we don't currently know all the details of what happens with aging, let alone how to fix everything. But the good news is that we are constantly making progress in both areas.

Trying to come up with an exact date for major life extension breakthroughs is difficult if not impossible. Some estimates are more convincing than others, but they are still estimates. Whether the singularity really happens in 2045 like Ray Kurzweil predicts is uncertain. But does it mean it will never happen? Of course not. As with most things that we can imagine but not currently implement, probability implies that it's really more a question of "when will it happen?" instead of "will it happen?". As the author puts it:

Science fiction aficionados have always argued that whatever humans can imagine lies within the realm of possibility — unlikely and far-fetched, perhaps, yet nonetheless possible. It’s a strong argument considering the impossibilities of the past that become the commonplace of the present and which will certainly be the humdrum obsolescence of the future.

It's really the idea of ending aging being possible (as in, pointing out that it doesn't violate any laws of physics and that we've already been able to do things like double the lifespan of mice) that needs to get more publicity in order to really get the wheels rolling, and that's what this column does. You'd be surprised how effective pieces like this can be in changing public opinion in matters considered fringe science. Each column, article and interview is like a battle won in a war.

For now, it looks like battles are being won all over the place. To quote Russell Crowe's 19th century character in the film Master and Commander: The Far Side of the Ocean: "What fascinating modern times we live in."

For more information on anti-aging, see these posts:

Intermittent Fasting Reduces Mitochondrial Damage and Lymphoma Incidence in Aged Mice
Anti-Aging in the Media: Houston Press on Caloric Restriction
Anti-Aging in the Media: The Globe and Mail on Telomerase
End Aging to End Anxiety: Filmmaker Jason Silva Talks about Immortality

Read More......


Digg Technorati del.icio.us Stumbleupon Reddit Blinklist Furl Yahoo

Saturday, March 14, 2009

Hyaluronic Acid for Skin & Hair – Experiment Conclusion

Hyaluronic acid for skin & hair - experiment conclusion
Collagen is responsible for skin strength and elasticity. (Photo by Silvio Tanaka)

This is the conclusion of my hyaluronic acid experiment.

For the past month, I've been taking 100 mg of hyaluronic acid daily (along with 200 mg chondroitin sulfate and 600 mg hydrolyzed collagen type II). The idea was to see whether it improved skin quality and affected hair growth, as suggested by some anecdotal evidence.

As with most of the stuff I've tested and written about on this blog, the results were disappointing. Or perhaps disappointing is the wrong word, since I was not really expecting much. In any case, I saw no effect from taking hyaluronic acid, neither positive nor negative. Skin looks as usual, hair grows as usual. All quiet on the western front.

One reason for lack of effects may be that the experiment was shorter than usual this time. Perhaps longer periods of use are needed to see results. And even though the label on the package says to only take 100 mg per day, some of the anecdotal evidence seems to be based on much higher daily intake and even non-oral methods of delivery.

However, taking even 100 mg of hyaluronic acid daily is not exactly cheap, so doubling or tripling the amount would make quite a dent in your budget. Even then it's anyone's guess whether you'll see results. Personally, I would look elsewhere for skin care products.

In case you are interested in trying it for yourself, the brand I used was Doctor's Best Hyaluronic Acid with Chondroitin Sulfate, which I purchased from iHerb.com. If you want to order from there and it's your first time, use coupon code "NEN423" for a $5 discount on any product. This 60 capsule bottle still seems to be the cheapest one I can find at the moment.

Maybe if the prices on hyaluronic acid go down (it's fairly new and not that well known at the moment, which may explain the cost) I'll try it again. For now, however, it's time to move on to new and improved experiments.

For more information on skin care and hair growth, see these posts:

Emu Oil and Hair Growth: A Critical Look at the Evidence
Topical Vitamin C, Vitamin E & Ferulic Acid – Experiment Conclusion
How to Get Natural Sun Protection by Eating the Right Foods
2% Nizoral Shampoo Increases Hair Growth More than 2% Minoxidil

Read More......

Digg Technorati del.icio.us Stumbleupon Reddit Blinklist Furl Yahoo

Friday, March 13, 2009

Moderate and Severe Caloric Restriction Alter Behavior Differently in Rats

Moderate and Severe Caloric Restriction Alter Behavior Differently in Rats
Giving rats less food makes them more social. (Photo from flickr.com)

Caloric restriction (CR) is known to increase the lifespan in a variety of species. It is assumed that this increase is largely due to a defense response resulting from low-intensity stress. This beneficial response to mild stress is known as "hormesis".

One theory that fits well with hormesis is that when the organism senses a scarcity of food, it begins directing resources into maintenance instead of reproduction, so that it will survive the scarcity and reproduce later. This "maintenance program" then results in several health benefits that ultimately manifest themselves as longer lifespan.

The effects of CR on many of the biological markers of health are pretty well understood. Less known, however, are the psychological effects of CR, especially when CR is begun in adulthood instead of childhood. To see how a decreased energy intake affects behaviour, Govic et al. put male rats on calorie-restricted diets and observed their social behaviour with other male rats.

Moderate (25%) CR vs. severe (50%) CR

The study included 32 adult male Wistar rats as experimental subjects and 10-week-old ad libitum fed rats as the stimulus animals in the social interaction test. The experimental rats were put on one of three diets: ad libitum (the control group), 25% calorie restriction (moderate CR), or 50% calorie restriction (severe CR).

As would be expected, the CR rats weighed significantly less than the control rats. The 25% CR rats gained less weight than the control rats, while the 50% CR rats lost weight during the course of the study.

For the social interaction experiment, each rat was placed into an arena with an unfamiliar male of the same size. The social behavioral elements that were measured were time until contact, duration of time spent in social exploration, and walking over the other rat. Non-social behaviors included time spent self-grooming and the frequency of environmental assesment as measured by rearing.

Effects on social behavior

Both groups on calorie restriction initiated social contact with the other rat sooner than the control group (Fig. 1A) . The rats in the control group took about 10 seconds to initiate contact with the unfamiliar rat, while in the CR groups it took about 5 seconds. Interestingly, the 25% CR rats were slightly more active than the 50% CR rats.

The calorie-restricted rats also spent more time in interaction with the unfamiliar rats than did the ad libitum fed rats (Fig. 1B). In the 50% CR group, the increase in social interaction was about 40%, while in the 25% CR group the increase was more than 80%. Thus, the moderate CR group did significantly better than the severe CR group.


Calorie restriction and social behavior
Fig. 1 - Effect of calorie restriction on social behaviors of rats.


Walkovers, which are considered a sign of dominance, were significantly more frequent in the 25% CR group than in the control group (a ~300% increase). However, in the 50% CR group, walkovers were actually less frequent than in the control group (Fig. 1C).

Effects on non-social behavior

The time spent self-grooming was the shortest in the 25% CR group (Fig. A). Compared to the control animals, they spent almost 80% less time grooming themselves. The 50% CR rats also spent less time grooming than the control rats, but the reduction was smaller, about 30%. The time spent self-grooming was used to measure an interest solitary and individual behaviour instead of social interaction, though the authors mention that this measure is not so clear-cut.


Calorie restriction and non-social behavior
Fig. 2 - Effect of calorie restriction on non-social behaviors in rats.


The frequency of rearing was greater in both CR groups (Fig. B). This time, the increase was significantly greater in the 50% CR group than the 25% CR group (about 30% vs. 210%). Rearing is considered indicative of exploratory and environmental assessment behaviour, which are in turn thought to reflect food seeking behaviour. Since the 50% CR animals had a severe restriction of energy intake, an increased interest in looking for food seems natural.

Conclusion

Both 25% CR and 50% CR resulted in rats that were generally more socially active than rats given free access to food. Rats on a moderate caloric restriction diet had the most significant effect: They initiated contact earlier, spent more time in social interaction and displayed more frequent walkovers than severely calorie-restricted rats. CR rats also spent less time engaged in solitary behavior and more time exploring their environment.

The authors comment that the social behavior of the adult CR rats was similar to that of pubertal rats. During puberty, male rats are socially interactive, but once they hit adulthood, social interaction becomes more rare (until in late adulthood it picks up again). The calorie-restricted rats thus acted younger than their age, with behavioral changes similar to those seen in rats put on CR during the neonatal period.

One explanation for the changes is the decreased testosterone resulting from caloric restriction, though this alone does not entirely explain why moderate CR resulted in more social interaction and more signs of dominance than severe CR or ad libitum feeding.

For more information on caloric restriction, see these posts:

Anti-Aging in the Media: Houston Press on Caloric Restriction
Anti-Aging in the Media: Newsweek on the Search for Longer Life
7 Human Experiments of 2008 – Year in Review
A Week of Caloric Restriction - Experiment Begins

Read More......


Digg Technorati del.icio.us Stumbleupon Reddit Blinklist Furl Yahoo

Thursday, March 12, 2009

2% Nizoral Shampoo Increases Hair Growth More than 2% Minoxidil

2% Nizoral Shampoo Increases Hair Growth More than 2% Minoxidil
Ketoconazole and minoxidil seem to work in different ways. (Photo by qmnonic)

In the previous post, I wrote about a study on the effects of ketoconazole on hair growth in men with vertex hair loss. I mentioned that the same paper also describes another experiment comparing the hair growth effects of ketoconazole and minoxidil, which is what we'll look at in this post.

Nizoral vs. minoxidil in hair growth

The second experiment had two groups with four men, age 24-29, in each. All of the men suffered from grade III hair loss of the vertex (the crown of the head). The first group used 2% Nizoral shampoo, while the second group used 2% minoxidil together with a normal shampoo.

There was no significant difference between the groups in hair shaft diameter and sebaceous gland area. Interestingly, however, the authors found a negative linear relationship between hair shaft diameter and the area of the corresponding sebaceous glands. In other words, the larger the glands that secrete sebum in the hair follicles, the thinner the hair.

Similar results, different mechanisms

After 6 months of using the treatments, the hair density of the Nizoral group went from 250 to 296 hairs per square centimeter; an increase of of 18%. In the minoxidil group, the increase was 11%, from 276 to 306 hairs. Both ketoconazole and minoxidil increased hair shaft diameter by 7%. Even though the sample size in this second experiment was very small, this looks like a very promising result.

The mean sebaceous gland area of the Nizoral group decreased by 19.4%. However, in the minoxidil group, the area increased by 5.3%. This means that even though both ketoconazole and minoxidil stimulated hair growth, they did it through different mechanisms. Still, even at the end of the study, the negative relationship between gland area and hair shaft diameter remained.

Conclusion

Ketoconazole, the active ingredient in Nizoral (and some other) shampoos, was more effective than minoxidil in increasing hair count in men with vertex hair loss after 6 months. The increase in hair shaft diameter was the same with both ketoconazole and minoxidil. The two products appear to work through different mechanisms, as ketoconazole decreased sebum production while minoxidil increased it.

For more information on hair growth, see these posts:

2% Nizoral Shampoo Increases Hair Growth in Men with Male Pattern Baldness
Topical Ketoconazole (Nizoral) Increases Hair Growth in Mice
How I Accidentally Grew Hair on My Left Temple with Retinol – Experiment Conclusion
Chinese Hibiscus Leaf Extract Increases Hair Growth in Mice

Read More......


Digg Technorati del.icio.us Stumbleupon Reddit Blinklist Furl Yahoo

Wednesday, March 11, 2009

2% Nizoral Shampoo Increases Hair Growth in Men with Male Pattern Baldness

2% Nizoral Shampoo Increases Hair Growth in Men with Male Pattern Baldness
Not all shampoos are created equal. (Photo by specialkrb)

I wrote in an earlier post about a study suggesting that topical ketoconazole increases hair growth in mice through an unknown mechanism. As interesting as rodent studies can be, the truth is that nothing beats experiments done on humans. That's especially true of hair growth studies.

Luckily, I found an old paper by Piérard-Franchimont et al. who compared the effects of topical ketoconazole to ordinary shampoos and minoxidil on people suffering from hair loss. Ketoconazole is the active ingredient in Nizoral, which is available as 1% and 2% strength. The latter was the one used in the study. Since the study included two separate experiments, I'm going to concentrate on the first one in this post and discuss the second one later.

Nizoral vs. normal shampoo in people with hair loss

In the first experiment, 39 men between 21 and 33 years with androgenic alopecia (AGA) on the crown of the head. The duration of hair loss ranged from 2 to 6 years. However, none of them reported having had dandruff or seborrheic dermatitis in the last six months, which means that they probably just had good old male pattern baldness.

The study included four groups: AGA + ketoconazole group, AGA + normal shampoo group, control + ketoconazole group, and control + normal shampoo group. Participants in the first two groups were the ones suffering from hair loss, while everyone in the two control groups had full heads of hair. The ketoconazole groups washed their hair with Nizoral shampoo 2-4 times per week for 21 months.

The authors had their own somewhat novel method of measuring the results. First, the proportion of vertex hairs in anagen (growth) phase was measured. Then the average diameter of hairs 1.5 cm from the bulb was measured. Finally, to give an overall score, the anagen percentage was multiplied by the average diameter. This score, titled Pilary Index (PI) by the authors, was measured every three months.

Results

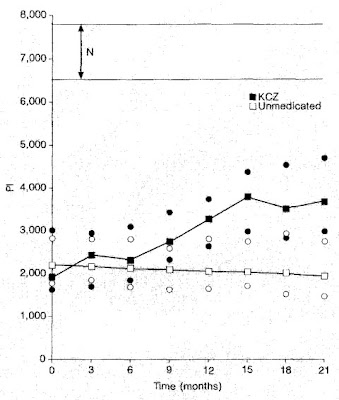
The graph below shows the PI of the two AGA groups. The black squares represent the participants with hair loss using Nizoral, and the white squares represent participants with hair loss using normal shampoo. The N and the arrow next to it refers to the PI values of the participants with no hair loss.


Ketoconazole (Nizoral) and hair growth
The PI score of the AGA + normal shampoo group declined steadily throughout the study. In other words, they kept losing their hair. On the other hand, the AGA + ketoconazole group increased their PI score, meaning that their anagen percentage and/or hair thickness improved. The effect was evident after 6 months and seemed to plateau after 15 months. Ketoconazole also seemed to decrease sebum levels in the AGA group, with a median reduction of 18% at the end of the study.

Compared to the AGA + normal shampoo group, the AGA + ketoconazole did considerably better. Even though the most drastic improvement was seen between months 6-15, the trendline was still up at the end of the study. And in fact, since a slight decrease was also seen between months 3-6, after which things picked up again, it may well be that Nizoral would have increased hair growth even further after the 21st month.

As good as the results were, the PI scores of the AGA + ketoconazole group were still far behind those of the control group. Unfortunately, the paper doesn't say whether ketoconazole affected hair growth in participants without hair loss.

Conclusion

In men with hair loss, using 2% Nizoral shampoo 2-4 per week significantly improved measures of vertex hairs in anagen phase and hair diameter during the course of a 21-month study. At 15 months, the increase in the hair growth score was close to 50%. A slight decrease in hair growth scores was seen in those using normal shampoo.

For more information on hair growth, see these posts:

Topical Ketoconazole (Nizoral) Increases Hair Growth in Mice
Emu Oil and Hair Growth: A Critical Look at the Evidence
Lygodium japonicum Promotes Hair Growth by Inhibiting Testosterone to DHT Conversion
Hyaluronic Acid for Skin & Hair – Experiment Begins

Read More......


Digg Technorati del.icio.us Stumbleupon Reddit Blinklist Furl Yahoo

  © Blogger template 'Perfection' by Ourblogtemplates.com 2008

Back to TOP